India’s Export Momentum Strengthens in August 2026
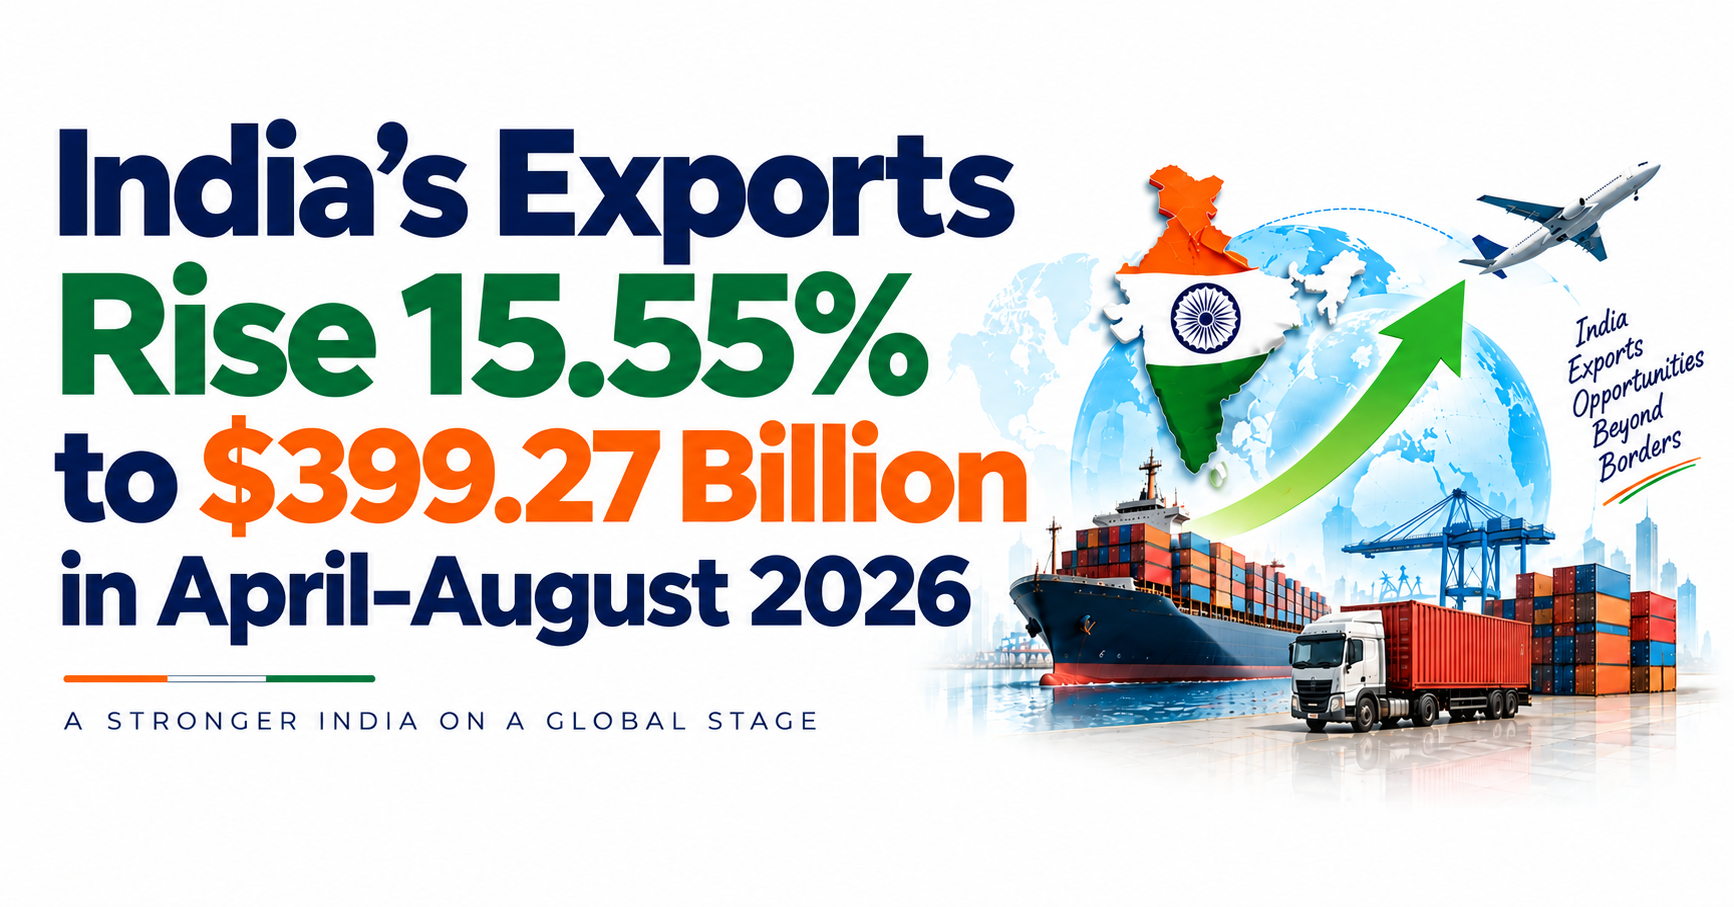
India’s total exports of merchandise and services rose 15.55% year-on-year to an estimated US$399.27 billion during April–August 2026–27, reflecting strong momentum across merchandise and services exports. Electronics, petroleum products, engineering goods and chemicals were among the key merchandise export drivers in August.
By IPO Master
India’s Export Momentum Strengthens in August 2026
India’s latest trade data shows a strong improvement in export activity, with total exports of goods and services estimated at US$82.68 billion in August 2026, up 25.41% from US$65.93 billion in August 2025. The data was released by the Ministry of Commerce & Industry through PIB on September 15, 2026.
Strong Growth Across Key Export Segments
A major highlight is the sharp increase in merchandise exports, which reached US$43.81 billion, compared with US$34.74 billion a year earlier.
Several sectors recorded significant growth:
Electronic Goods: +89.82% to US$5.55 billion
Petroleum Products: +63.27% to US$6.81 billion
Engineering Goods: +24.86% to US$12.32 billion
Organic & Inorganic Chemicals: +16.38% to US$2.80 billion
Cotton Yarn, Fabrics & Handloom Products: +13.79% to US$1.12 billion
The performance shows that export growth is coming from a relatively broad mix of manufacturing and industrial categories rather than from a single segment.
Services Continue to Add Strength
India's services exports were estimated at US$38.87 billion in August 2026, compared with US$31.19 billion in August 2025.
For April–August 2026-27, services exports are estimated at US$183.36 billion, compared with US$162.34 billion during the same period a year earlier.
April–August Numbers Tell a Bigger Story
During the first five months of FY2026-27:
Total exports: US$399.27 billion
Growth: 15.55% YoY
This compares with US$345.55 billion during April–August 2025-26.
However, imports have also increased.
Total imports during the same period were estimated at US$459.65 billion, resulting in a combined trade deficit of approximately US$60.38 billion.
What Is Driving Export Growth?
The latest numbers point towards stronger performance from:
Electronics → Engineering → Petroleum → Chemicals → Textiles
Electronic goods are particularly notable, with exports almost doubling year-on-year in August.
The government data also shows positive export growth across several other categories, including iron ore, marine products, handicrafts, plastics, coffee and pharmaceuticals.
Global Markets Also Matter
The United States, Singapore, Spain, China and Tanzania were among the destinations showing notable increases in export value during August 2026.
For the April–August period, Singapore, China, the US, Tanzania and Malaysia recorded significant increases in export value compared with the previous year.
What Does This Mean for India?
The latest data provides an important snapshot of India's external sector.
Strong merchandise and services exports can support:
Manufacturing activity
Industrial production
Employment
Foreign-exchange earnings
Capacity expansion
India's position in global supply chains
At the same time, the rising import bill and widening merchandise trade deficit remain areas to watch.
Key Takeaway
India's August export numbers show strong momentum across electronics, engineering, petroleum, chemicals, textiles and services.
The bigger question is whether this export momentum can remain consistent through the rest of FY2026-27, particularly as global demand, commodity prices, exchange rates and international trade conditions continue to evolve.
Use the list on the right to open the next post.